Moving Averages for Stock Traders
6 分で読めます
Moving Averages: The Market's Trendlines
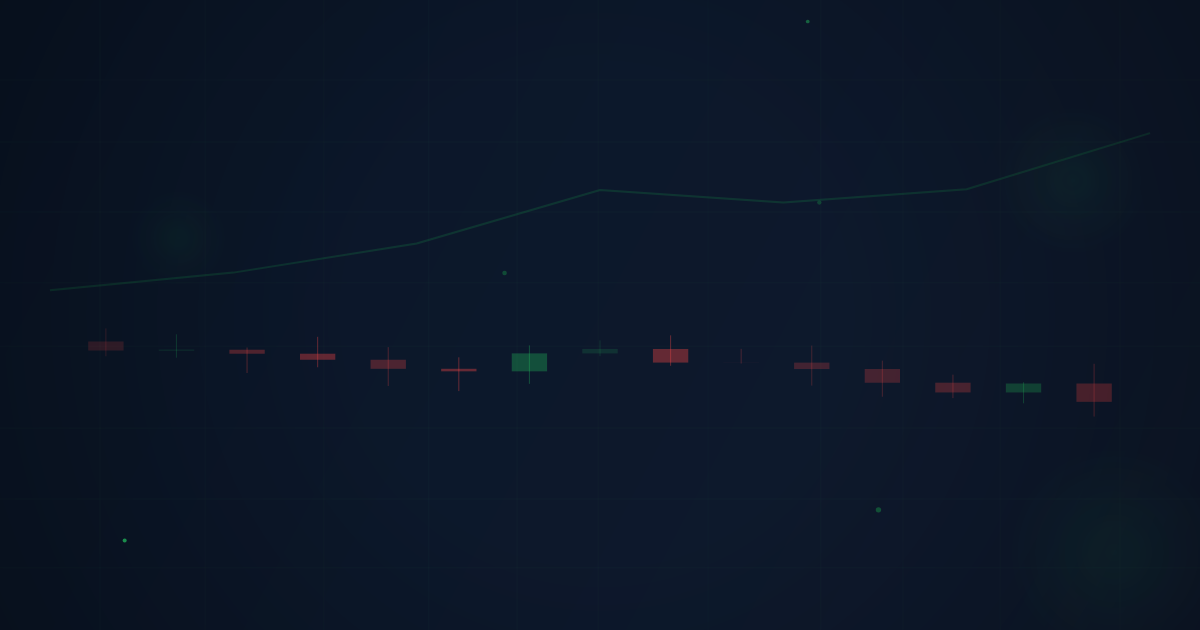
A moving average (MA) calculates the average closing price over a specified number of periods, creating a smooth line on the chart that filters out short-term noise and reveals the underlying trend. Moving averages are the most widely used technical indicators in stock trading, and for good reason — they work.