Footprint Charts and Order Flow Tools
7 min czytania
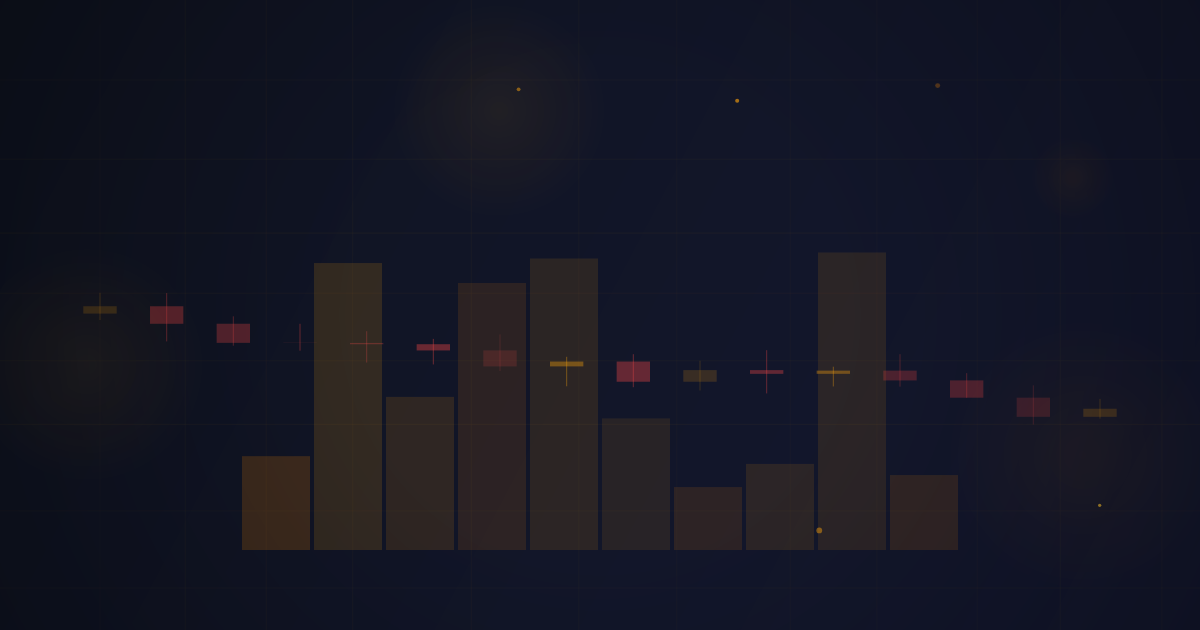
The Most Detailed View of Price Action
Footprint charts (also called cluster charts or order flow charts) are the most granular way to view market activity. Instead of showing just OHLC data per candle, footprint charts break down each candle into individual price levels and show the exact volume traded at the bid and ask at each level.
Zarejestruj się, aby kontynuować naukę
Utwórz darmowe konto, aby uzyskać dostęp do większej liczby kursów.
Darmowa RejestracjaMasz już konto? Zaloguj sięZastosuj swoją wiedzę w praktyce
Śledź swoje konta prop firm, analizuj transakcje i rozwijaj się jako finansowany trader z PropTally.
Darmowa Rejestracja