Footprint Charts and Order Flow Tools
อ่าน 7 นาที
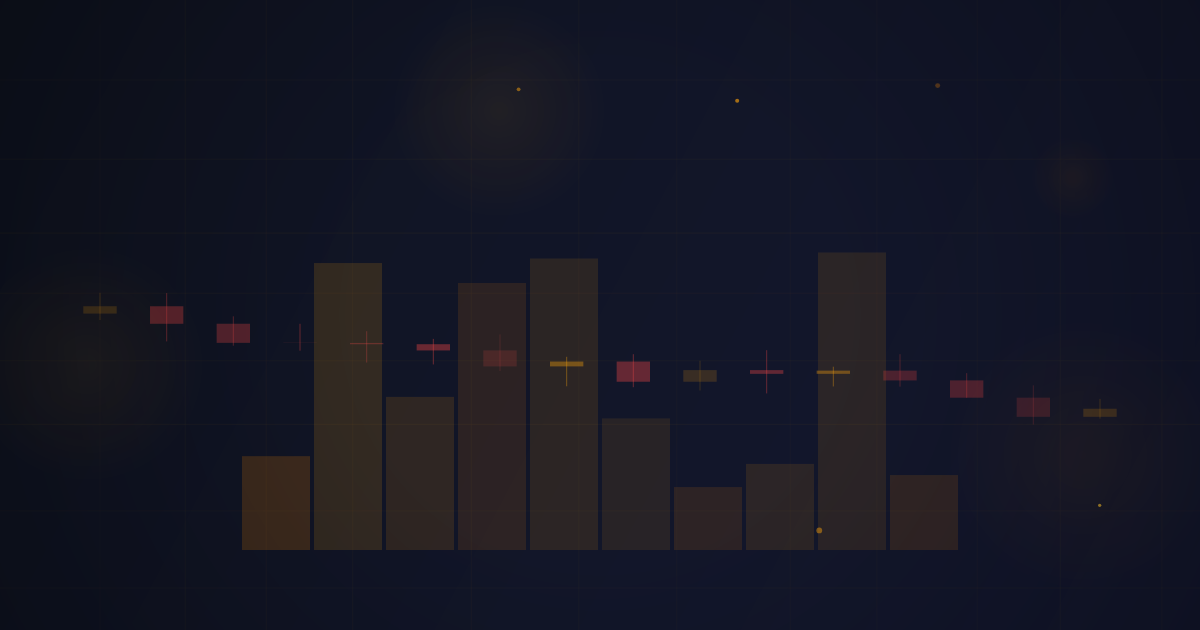
The Most Detailed View of Price Action
Footprint charts (also called cluster charts or order flow charts) are the most granular way to view market activity. Instead of showing just OHLC data per candle, footprint charts break down each candle into individual price levels and show the exact volume traded at the bid and ask at each level.
นำความรู้ไปใช้จริง
ติดตามบัญชี Prop Firm วิเคราะห์การเทรด และเติบโตในฐานะเทรดเดอร์ที่ได้รับทุนกับ PropTally
สมัครฟรี